Retain the originals
Keep source images, text or file references beside the processed results for comparison.
Use case
Each week requires fresh channel summaries, charts and commentary. Specify the period and metric definitions, then review the Agent’s calculations and flagged changes.
Weekly summary, channel comparison chart and commentary traceable to the data.
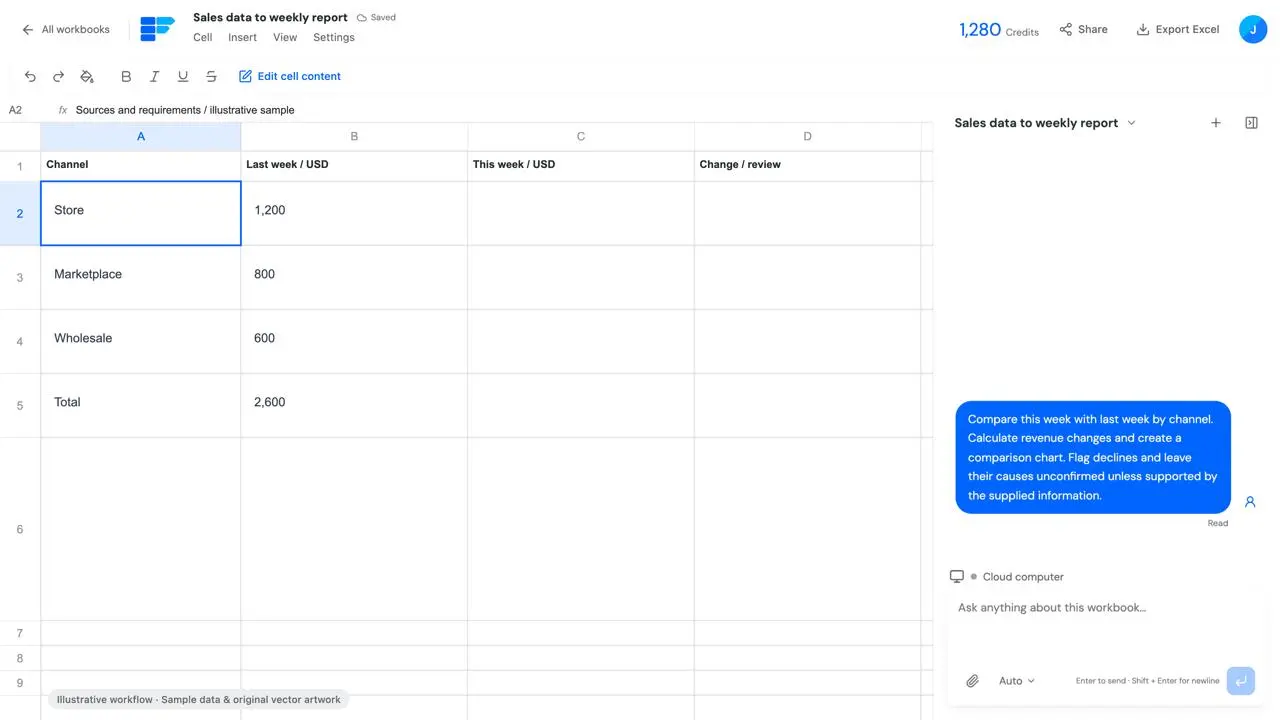
Start your workCompare this week with last week by channel.
This page focuses on one task: Weekly summary, channel comparison chart and commentary traceable to the data.
Sales records for both periods, channel fields, revenue definitions and date range.
Keep source images, text or file references beside the processed results for comparison.
A change does not establish its cause; conclusions must be supported by the supplied data.
Sales records for both periods, channel fields, revenue definitions and date range.
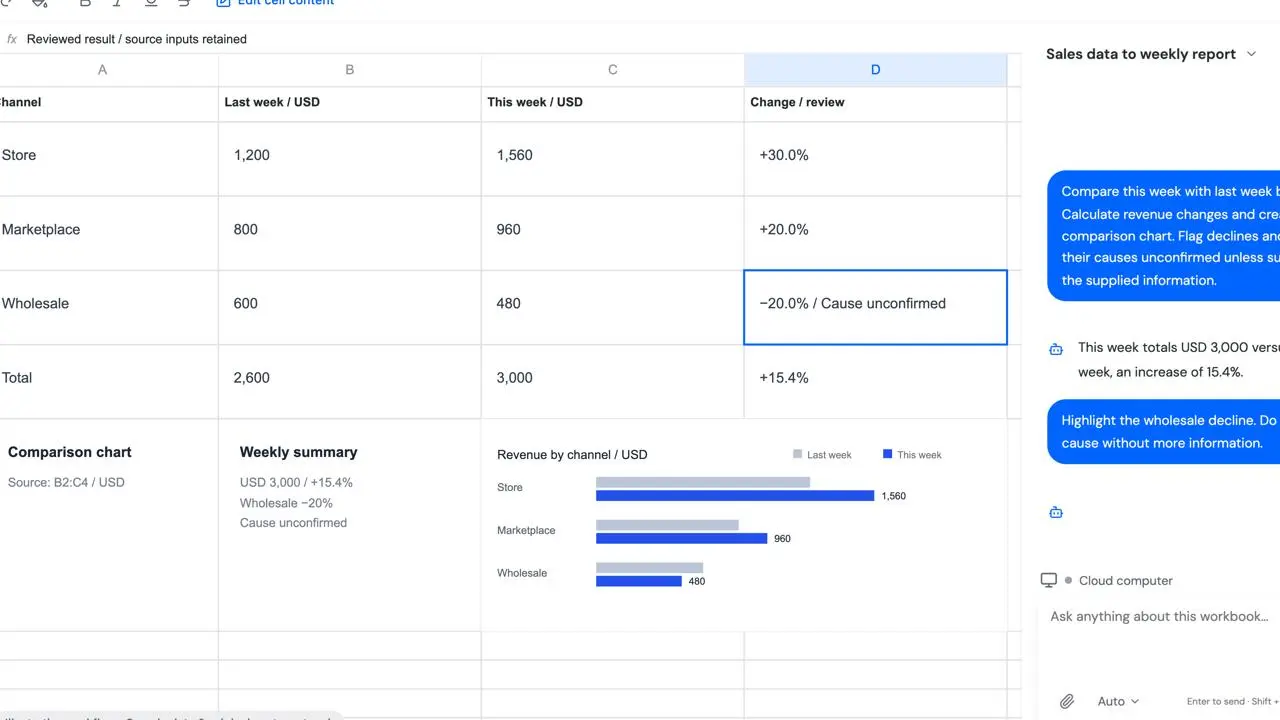
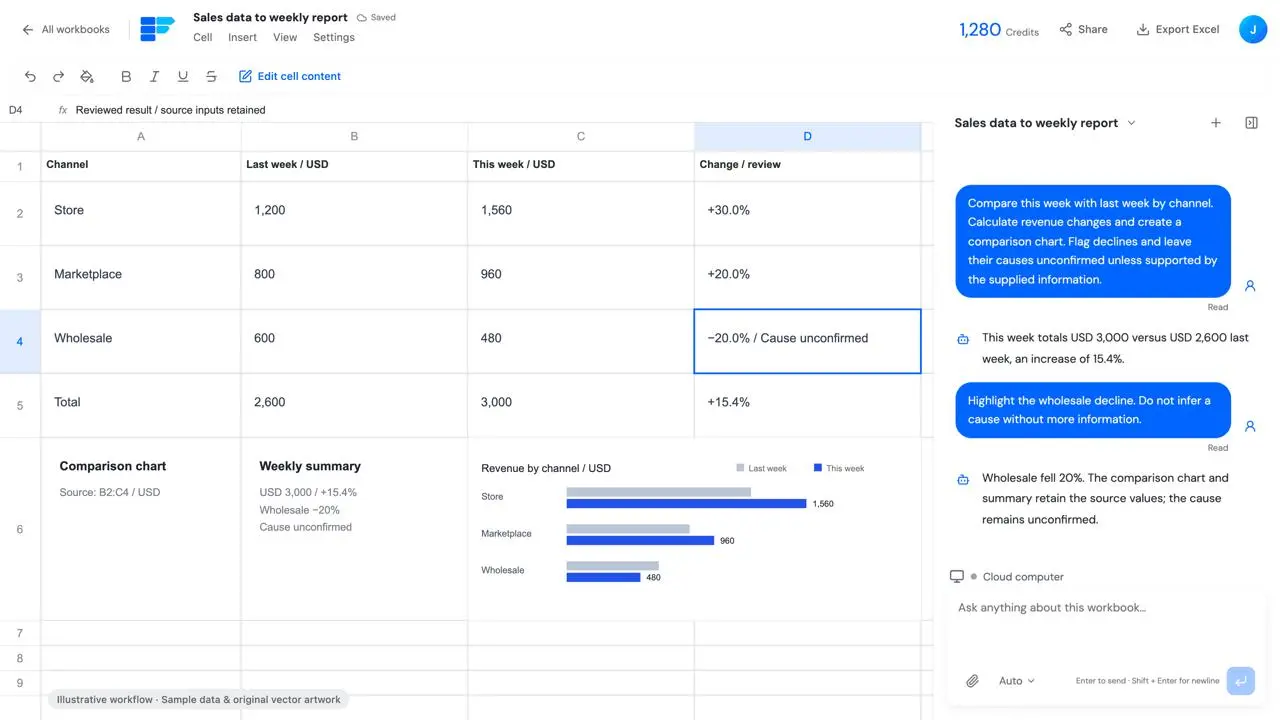
Compare this week with last week by channel. Calculate revenue changes and create a comparison chart. Flag declines and leave their causes unconfirmed unless supported by the supplied information.Each week requires fresh channel summaries, charts and commentary. Specify the period and metric definitions, then review the Agent’s calculations and flagged changes.
A change does not establish its cause; conclusions must be supported by the supplied data.
Weekly summary, channel comparison chart and commentary traceable to the data.
Weekly summary, channel comparison chart and commentary traceable to the data.
Identify the row, cell or result to change and review that part while retaining the rest.
A change does not establish its cause; conclusions must be supported by the supplied data.
Sales records for both periods, channel fields, revenue definitions and date range.
A change does not establish its cause; conclusions must be supported by the supplied data.
Illustrative workflow with fictional data and original vector artwork; not a live customer task, generation result or external action.
This demonstration does not execute a task. Work starts after you submit a request in the workspace, subject to the actual configuration, approval requirements and costs.
Sales records for both periods, channel fields, revenue definitions and date range.